At UGRC we greatly value collaboration and sharing ideas. A terrific technology to support these values is the Jupyter Notebook, opens in a new tab project.
Jupyter Notebook consists of a web application tied to an interpreter to execute code. The notebook medium allows for sharing narrative text, images, figures, and executable code all in the same transportable package. Jupyter Notebook can be run in many different environments, such as Google Colab, opens in a new tab or ArcGIS Pro Python, opens in a new tab. Lately we have been using the project to share things like: open source GIS demonstrations, log analysis, and complex data transformations.
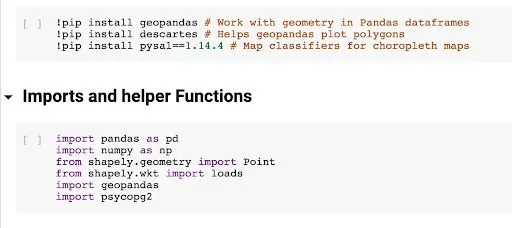
UGRC uses many different GIS technologies to get our work done. While proprietary ESRI GIS software is our current workhorse, open source GIS solutions, like GeoPandas in a Jupyter Notebook, are also great for the unique capabilities they offer. One of the benefits of open source GIS is the ability to share solutions with a broad audience. This open Python spatial notebook, opens in a new tab running in Colab demonstrates open source GIS software like Shapely, opens in a new tab, GeoPandas, opens in a new tab, and PostGIS, opens in a new tab.
The open Python notebook also uses Google’s BigQuery GIS, opens in a new tab. While BigQuery is not technically open source, the BigQuery GIS functions do follow the PostGIS API, and you can query 1 TB of data for free every month. (Just for perspective, with 1 TB you could run the BigQuery cell in the notebook at least 7,500 times a month without providing a credit card.) Read this Google blog post, opens in a new tab to learn about setting up BigQuery.
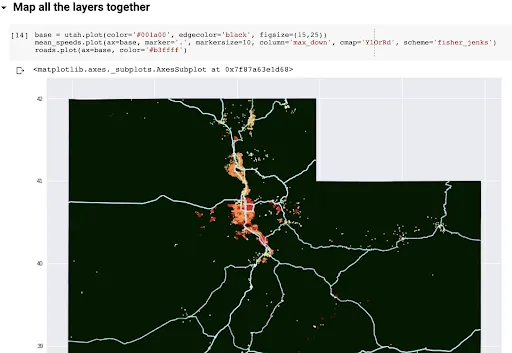
Run this notebook, opens in a new tab yourself to see Utah’s broadband speeds at a random sample of address points.
In line with our value of sharing ideas, at UGRC we also really like to share data. Well, really, we just like data, in general. In fact, we even like data about data. We have also discovered just how useful data about the use of data (i.e., logs and usage metrics) can be.
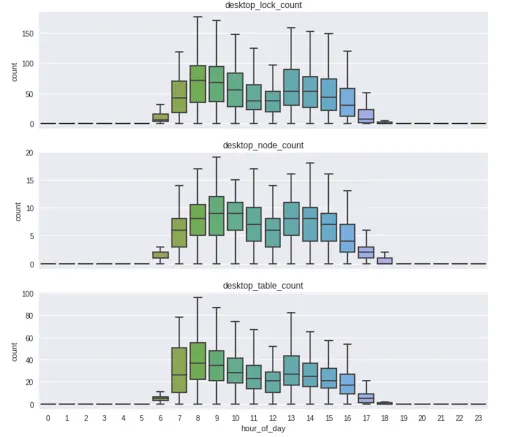
One of the things we recently decided to track usage metrics on is our SDE SQL server, which is full of GIS tables. Most of our users know this database as sgid.agrc.utah.gov. Tracking usage of a database can be done in many ways: we could track database connections, transactions per second, or even CPU usage. But we wanted a metric that captured some of the unique aspects of using our database with ArcGIS clients, so we chose to track shared table locks. (The SGID lock metrics are stored in BigQuery, so you’ll need a free GCP project to run this notebook yourself.) This exploration of the SGID logs notebook, opens in a new tab shows some of the information that can be gleaned from shared lock counts when they are aggregated by both application server machines and desktop computer users.
Working with log data, or any other source of data, can involve multiple data transformations. Sometimes many transformations and analysis need to be applied to data, and the work is distributed across multiple people in our office. When more than one person is involved in a process, good communication and documentation become much more important. This notebook created with the ArcGIS Pro environment, opens in a new tab shows work done for our current multi-modal project. For this project, the general transit feed specification (GTFS) files produced by the Utah Transit Authority need to be transformed into a format that would work with ESRI’s Network Analyst while maintaining the ID structure of the original GTFS. The notebook shows how we parsed the GTFS files and transformed them into a shapefile format that could be consumed by ArcGIS. The notebook was created with the ArcGIS Pro installation of Python and was then pushed to Github. Github has a very nice feature of rendering notebooks with outputs and code shown in the Github web application.