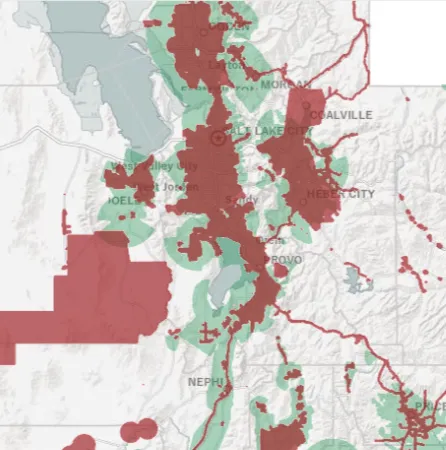
If you’ve ever used our broadband service layer, you’ll know it’s rather unwieldly. Today, in partnership with the Utah Broadband Center (UBC), we’re excited to announce a new version of our residential broadband service areas that are easier to use and more accurately reflect service availability. This layer answers the question “what service is available from whom in which areas?”
This new layer uses the FCC’s Broadband Data Collection, opens in a new tab data and the H3 spatial index, opens in a new tab developed by Uber for three big improvements:
- More accurate service data.
- Cleaner and simpler geometries.
- Easier and more frequent updates.
You can check out this new layer in action in the Utah Broadband Center’s updated Utah Residential Broadband Map, opens in a new tab.
Chasing Perfection
This new layer isn’t perfect. There are a few limitations you should be aware of.
First, the areas can and do overstate residential broadband coverage. Because we’re aggregating up to H3 level 8 geometries, some areas will show coverage because there’s only one or two BSLs in that whole area. This is a limitation of any aggregated dataset and is a result of license restrictions explained below. This dataset is not intended to provide address-level service information; users can visit broadbandmap.fcc.gov, opens in a new tab to check for service at specific locations.
Second, our data are only as good as the source FCC data. We depend on specific fields, such as the business/residential code field, to subset the source datasets. This may create coverage polygons in areas where business-only points were misclassified as residential or multi-use.
Third, we no longer include mobile wireless coverage (such as home internet based on cell phone networks). These coverage data are reported differently to the FCC and don’t follow the same spatial format as fixed location broadband service. However, fixed wireless service that relies on a stationary point-to-point antenna link between a residence and a base transmitter is included.
Out With the Old
Our previous broadband service layer got its data from two sources: many providers responded to the UBC’s twice-yearly request for coverage data, and for other providers we would download the data they submitted to the FCC under the old Form 477, opens in a new tab.
The first problem with this process is the amount of time it took us to combine all the different sources of data. Some came in as spatial data, while others were in tabular form that we had to convert to spatial data. This took a lot of time and the differences between providers and formats meant it couldn’t be automated.
The complexity of the resulting geometries posed a large problem with storage, display, and analysis. Each provider had individual features for each unique pair of upload and download speeds, and these often contained extremely complex geometries with many vertices. Some wireless coverages were represented as vectorized versions of raster viewshed analyses.
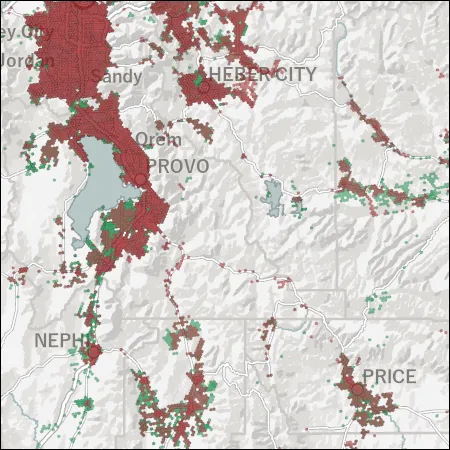
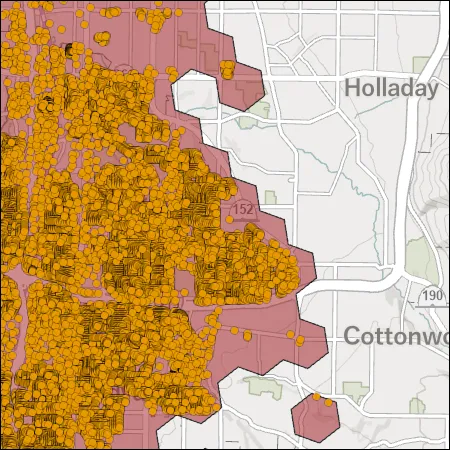
Crucially, the largest problem we had was the accuracy of the data. There was no feedback mechanism to challenge service claims. The aforementioned raster viewshed analyses were run on simple assumptions about signal strength over distance and a very binary visible/not visible cutoff. Some providers only provided data about their backbone lines and we had to make the assumption that service would be available within an arbitrarily-chosen distance from that line. These are all visible in the old residential broadband map:
In With the New: The FCC’s Broadband Data Collection
Over the last five years or so, the FCC has completely changed the way providers report their coverage through the FCC’s Broadband Data Collection (BDC) process. They have partnered with a third party company, CostQuest, to develop “The Fabric”, opens in a new tab. This consists of points for every Broadband Serviceable Location (BSL): every location that has, or could conceivably order, mass-market broadband internet. The fabric continues to be updated on a twice-yearly schedule to reflect corrections and new construction.
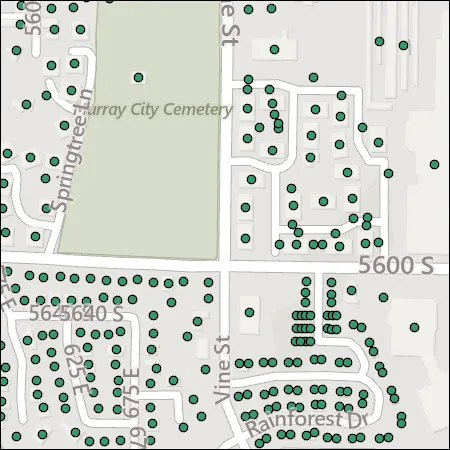
With this foundational geometry in place, the FCC now requires providers to report their service coverage by BSL. Providers can either submit lists of BSLs or polygon coverage areas. The FCC then provides the public access to the coverage data via broadbandmap.fcc.gov, opens in a new tab.
One benefit of the BDC is its built-in feedback mechanisms. Individuals, governments, and providers can all submit challenges about either the fabric (adding a missing location or disputing an existing BSL) or the claimed broadband service at a given BSL.
The largest limitation with the BDC is the licensing limitations of the fabric. Because it was created by a third party contractor and subsequently licensed by the FCC, it is not an open and public dataset. While we can publish aggregate derivative datasets, we can’t share the individual points in a way that would allow someone else to extract the point data. This makes displaying the points while allowing for filtering difficult.
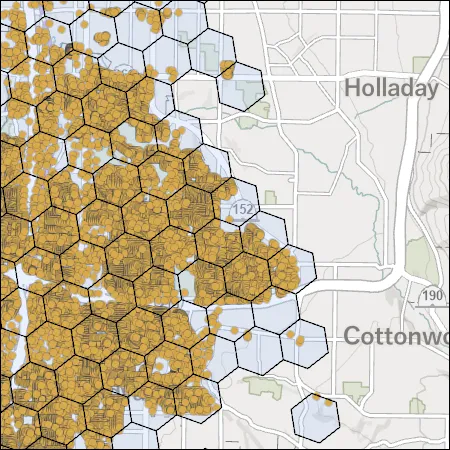
Representing Point Data as an Area: Hexagons to the Rescue
For our new dataset, we use the H3 spatial index to aggregate the FCC’s point data up to a series of hexagons representing coverage areas. This solves all the problems with both our previous data and the BDC.
This new layer has multipart polygons for each unique combination of provider name, technology, upload speed, and download speed. Users can quickly filter by provider, technology, or speeds to evaluate what service looks like in their area.
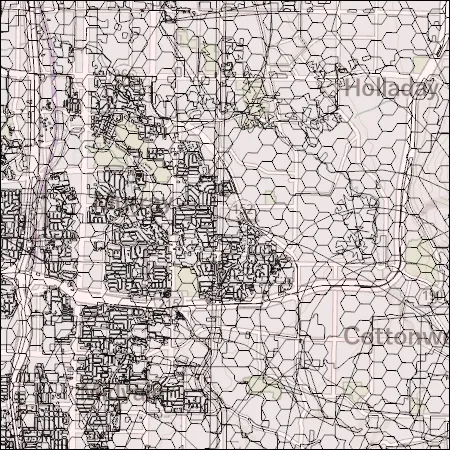
The new layer consists of the BDC data aggregated to H3 level 8 geometries using the H3 IDs provided by the FCC for each BSL. Each level 8 hexagon is about four Salt Lake City blocks wide (about 2/3s of a mile between opposing vertices) and covers about 14 blocks. We aggregate BSLs based on their provider name, technology, max upload speed, and max download speed. We then dissolve the resulting geometries containing similar values for these four fields.
To speed things up, we have automated, opens in a new tab the update process using the FCC’s API for accessing the BDC data. This eliminates the need for the Utah Broadband Center to reach out to providers individually, the need for providers to respond to both the FCC and the state, and UGRC’s long and laborious work to combine all the different responses into a single cohesive dataset. It also keeps the layer up-to-date with the latest FCC data.
We’ve also drastically simplified the data geometries by using the standardized H3 index and dissolving similar hexes together. By starting with the basic spatial unit of a hex with six vertices and then dissolving them together, many hexes’ vertices are completely removed because they’re in the middle of a much larger polygon. This massively simpler geometry shrinks storage space, rendering time, and analysis complexity.
By aggregating the individual BSL data up to H3 level 8 geometries, we are able to comply with the Fabric licensing terms while still providing useful polygon representations of service areas. The remaining limitation is that we can’t guarantee every location within a hexagon has the stated service available. It only means that at least one location within the hexagon does. Individuals can still use the FCC’s map, opens in a new tab to check service claims for specific locations.
We hope you find this new layer easier to use. If you have any questions or feedback, please contact Jake Adams from UGRC at jdadams@utah.gov.