We are surrounded by data. Sometimes it’s obvious, like the rising and falling of stock prices or the general trends that help us estimate today’s weather. But beyond what we check on our phones or receive in our email inboxes, there’s lots of data that impacts your day-to-day life that you might be less familiar with. Those datasets are kind of like those little brown birds you see clustered in parking lots, flying from tree to tree along the sidewalk, or making their homes in the eaves of your neighbor’s house.
To the untrained eye, they might just look like someone copied and pasted a million of the same bird. But to someone interested in birds, those avian friends have names and distinct features—they’re not just random little birds, they’re sparrows, finches, warblers, nuthatches, thrashers, wrens, siskins, waxwings…you get the idea.
Once you learn the names of those little birds, it opens up a whole new world of understanding. The same is true of these somewhat more hidden datasets—you might encounter them everyday, but do you know their names and where they come from? Well, grab your binoculars, because today we’ve going to learn about just a few of these statewide datasets that you’ve probably seen before, but might not have realized you were seeing.
Address Points
Address points are exactly what they sound like—it’s a point dataset where each and every data record represents a unique address in the United States Postal Service system. Throw all those points on a map, and they look something like this:
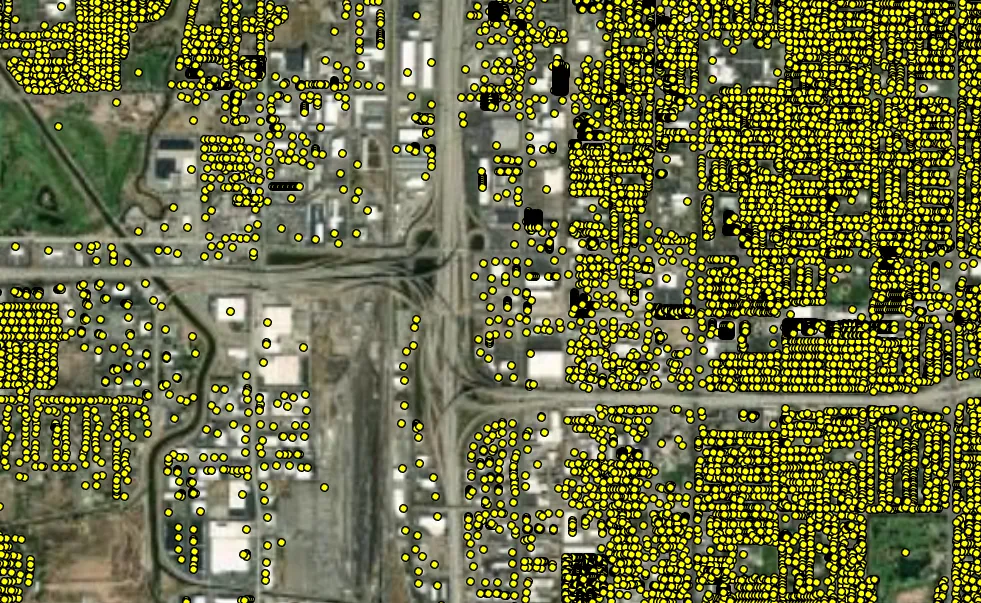
There are currently over 1.4 million address points in our state, representing all kinds of locations from houses to restaurants to the Utah State Capitol. These address points are used in many different ways. Popular navigation apps such as Google Maps use our address points dataset to know where your house is on a map. Package delivery services use these points to make sure your packages go where they’re supposed to. Emergency services use this same dataset to speed up response times.
Many other public and private entities also use address points for a process known as geocoding. In fact, UGRC provides a geocoding endpoint in the UGRC API that uses the latest addressing data to ensure the most accurate results. You can learn more and start geocoding your own addresses by signing up for the API on the self service website, opens in a new tab.
But these address points aren’t the only dataset helping navigation apps, emergency services, and mail delivery know where real-world buildings are located on a digital map. These address points are also part of a larger, invisible system that keeps every city and county’s addressing systems from getting tangled up like Christmas lights.
Address System Quadrants
The address you entered into your phone for a pizza order or a package delivery isn’t just a random series of letters and numbers. It’s a unique location within an addressing system. We can make digital representations of these addressing systems to assign addresses to certain locations—and to keep them from getting assigned to the wrong area. With the address system in place, we’re ready to pinpoint where each individual address lies on a map.
Utah has nearly 800 unique address system quadrants. All stitched together, they look something like this:
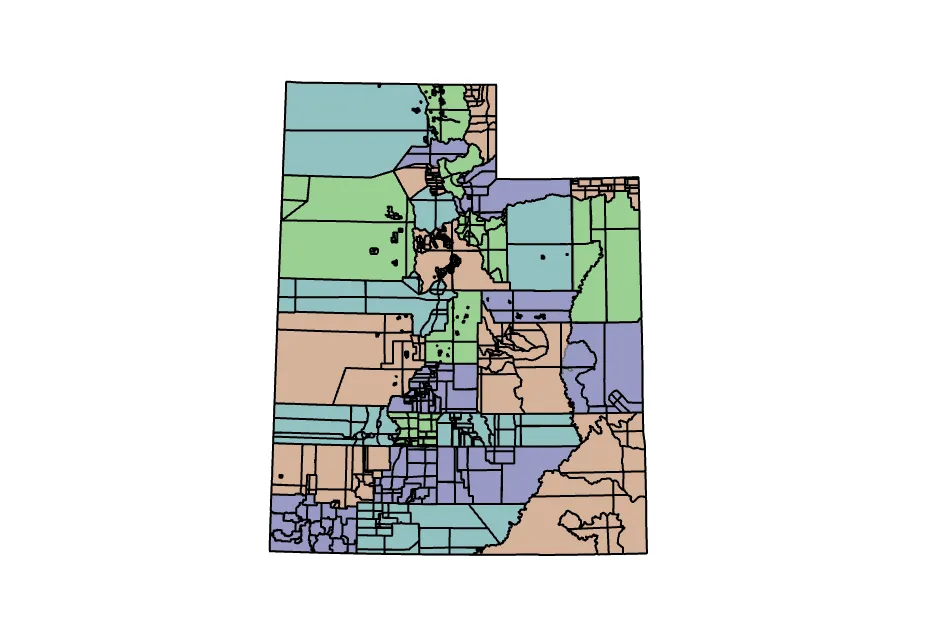
Each addressing system consists of an origin coordinate, a north-south axis, an east-west axis, and a boundary in which address numbers are assigned using a grid. The originate coordinate (0,0) is typically located at the intersection of Main and Center streets. This convention governs the assignment of addresses and is typically expressed as 100 address ranges per block or 800 address ranges per mile. And not all cities have their own addressing system; in fact, many municipalities can be contained within a single address system. For example, the Salt Lake address system includes all municipalities in Salt Lake County.
By combining the address system quadrants and the address points datasets, we’re putting together a more accurate digital picture of where things are in our state. But just knowing where this or that place is doesn’t get us very far—we need to be able to go from point A to point B. That’s where our statewide roads dataset comes in.
Roads
Just like how our favorite navigation apps don’t just magically know where all the buildings in Utah are, they don’t magically know where all the roads are either. So how does the app know to tell you to turn left in 500 feet? They use statewide datasets like Utah Roads from the SGID.
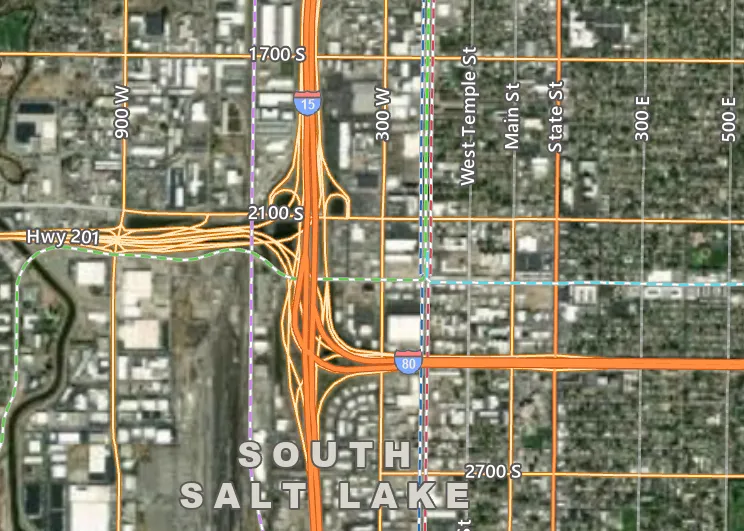
Whether you’re delivering a package, on your way to work, or looking at the latest traffic update, you’re accessing UGRC’s Roads dataset, which is updated every month and is used in a wide variety of projects. With over 400,000 digital road segments, it’s the most comprehensive roads dataset available in our state. Keeping an inventory of every highway, country back road, and neighborhood street wouldn’t be possible without the help of our amazing county offices and partners at UDOT.
In fact, all of the datasets we’ve talked about so far—address points, address system quadrants, and roads—are all maintained as a joint effort between UGRC, local governments, and fellow state agencies. This collaboration is at the heart of everything we do at UGRC.
All of the datasets we’ve covered in this post have also been vector datasets—which means they are discrete shapes in the form of points (address points), lines (roads) and polygons (address system quadrants). But what about raster data? How does that affect our day-to-day lives?
Discover Basemap and Imagery Server
UGRC’s Discover server just celebrated ten years of activity earlier this year! Discover is our one-stop shop for aerial imagery and custom Utah basemap services, all available from UGRC for free to public and licensed users. Our nearly 2,000 registered accounts include all kinds of government agencies from the Utah Department of Transportation to the Utah Division of Wildlife Resources. Even if you’ve never used Discover, the imagery and basemaps available on the server are used in all kinds of planning operations that impact many areas of Utah life, such as:
- Drinking water budgeting and distribution
- Transportation safety and planning
- Rural public land issues
- Broadband access expansion
- 911 and emergency response
- Natural resources management
- Infrastructure/Asset Management
These are just a few of the possible use cases for statewide imagery. You can learn more about what private organizations, government agencies, and others are doing with the power of Discover on our blog.
There’s Always More Data
While we’ve picked out just a few datasets to chat about, there’s many more that impact daily life. There’s the Public Safety Answering Point (PSAP) boundaries, which are used to make sure your 911 call goes to the correct dispatch center. There’s the parcel and land ownership data, which are used for all kinds of analytics and operations planning. And beyond these, there’s so many other ‘little brown data birds’ that elevate the quality of life for residents in Utah. These datasets, along with more than 300 other unique layers, can be found in the Statewide Geographic Information Datasource, or SGID. You can browse these datasets using the SGID Index or by viewing the array of data categories. For questions or comments regarding SGID data, don’t hesitate to reach out to our team.